MoneyGram launched MGUSD, a US dollar stablecoin on Stellar, as the remittance company deepens its push into blockchain-based cross-border payments.
The company said Tuesday that MGUSD will be integrated into the MoneyGram app through a self-custodial wallet, allowing users to hold dollar-denominated balances, move funds globally and convert into local currencies. The stablecoin initially launched in the US market, with plans to scale worldwide.
MGUSD is backed by a notable infrastructure stack. The tokens are issued by Bridge, Stripe’s stablecoin platform, which received conditional approval from the US Office of the Comptroller of the Currency to operate as a federally chartered national trust bank in February.
MGUSD is issued by Bridge, Stripe’s stablecoin platform, with mint-and-burn smart contract infrastructure from M0 and wallet infrastructure from Fireblocks.
The launch marks a deeper step in the remittance industry’s stablecoin push, shifting from backend settlement and payout partnerships toward app-based digital-dollar balances for consumers.
MoneyGram said MGUSD builds on its long-running partnership with the Stellar Development Foundation. The company described the stablecoin as a deeper move into issuance, balance infrastructure and broader network utility.
Remittance costs drive onchain push
The launch comes as remittance firms increasingly test blockchain infrastructure for cross-border payments, a sector that remains costly and inefficient compared with domestic systems.
Global cost of sending $200 in remittances. Source: World Bank
In a 2026 paper, the Bank for International Settlements (BIS) said cross-border payments remain “more costly, less accessible, slower, and less transparent” than domestic payments, despite new payment arrangements. Retail cross-border payments can also take several days, while transparency can be limited.
Related: Western Union teams with Crossmint to support USDPT stablecoin on Solana
World Bank data showed that sending $200 across borders cost an average of 6.36% in the third quarter of 2025, meaning fees and foreign-exchange margins consumed about $12.72 of a $200 transfer. That remains more than double the United Nations Sustainable Development Goal target of 3%.
Stablecoin transfers can reduce the blockchain settlement component of a payment to a fraction of a cent, though users may still pay on-ramps, off-ramps, foreign exchange spreads and local payout fees. Stellar’s developer documentation says the network minimum fee is 100 stroops, or 0.00001 XLM (about $0.000002) per operation.
Stablecoins have also grown into a large enough market to draw attention from payment firms. DefiLlama data shows that the total stablecoin market cap is at around $320 billion, while Citi forecast in September 2025 that stablecoin issuance could reach a base case of $1.9 trillion by 2030.
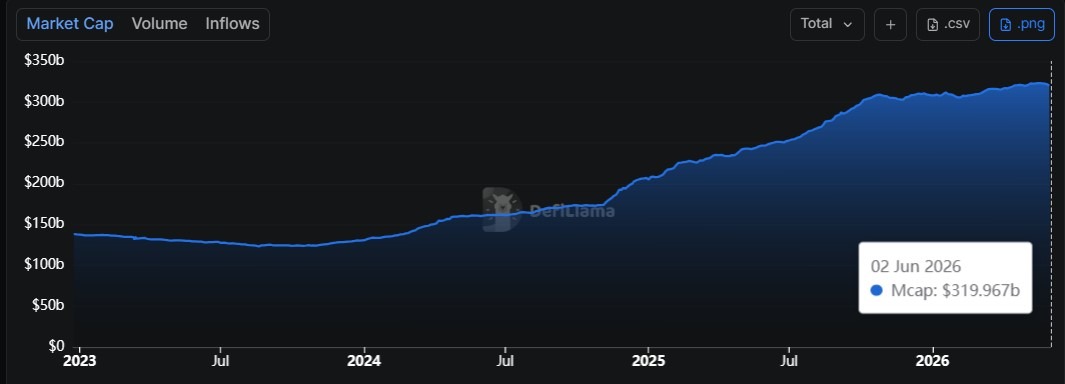
Stablecoin market cap. Source: DefiLlama
That cost gap and stablecoin growth help explain why remittance companies are testing stablecoin infrastructure. On May 5, MoneyGram partnered with crypto exchange Kraken to allow users to convert crypto into cash for pickup across 100 countries. On May 20, the company partnered with the Stripe-incubated blockchain Tempo to support stablecoin settlement and help validate remittance transactions.
Its business rival, Western Union, has also moved into stablecoins. On May 5, the company began rolling out its USD stablecoin called USDPT on Solana, initially in Bolivia and the Philippines, with plans to expand to over 40 countries in 2026.
Magazine: 50K investors fight Korean crypto tax, Singapore cancels Bsquared: Asia Express