Strategy’s Bitcoin holdings fell deep into paper-loss territory as BTC traded below the company’s average purchase price, renewing scrutiny of Michael Saylor’s Bitcoin treasury model.
Strategy holds 843,706 Bitcoin (BTC) acquired at an average price of $75,699 per coin, with a total cost basis of $63.8 billion. However, the latest Bitcoin downturn sank the value of Strategy’s Bitcoin reserve to $52.6 billion, pushing its unrealized loss to $11.2 billion, according to the company’s dashboard.
Strategy’s variable-rate perpetual preferred stock, STRC, has also declined below its intended $100 value and is traded at $94.6 at the time of writing. Strategy’s (MSTR) stock price was down 1.5% in pre-market trading to $124.7 on Thursday, Yahoo Finance data shows.
The paper loss adds to scrutiny of Strategy’s Bitcoin treasury model as BTC trades below the company’s average acquisition price, while the downturn in STRC price could complicate future preferred-stock issuance to fund its Bitcoin acquisitions. It comes days after Strategy announced the sale of 32 BTC, its first sale since 2022.
Strategy dashboard with key metrics on its Bitcoin reserve. Source: Strategy.com
Saylor pushed back on the bearish read Thursday, saying that mounting exchange-traded fund (ETF) outflows are “pressuring BTC,” and capital markets have poured $400 billion into AI infrastructure over the past six months.
“This is a capital rotation, not a Bitcoin impairment. Volatility creates opportunity,” said Saylor in an X post.
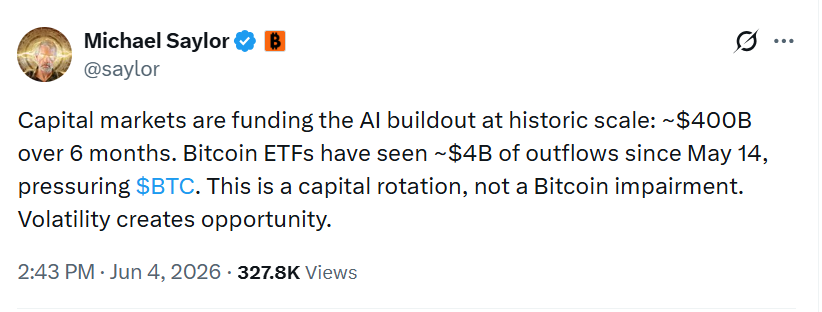
Source: Michael Saylor
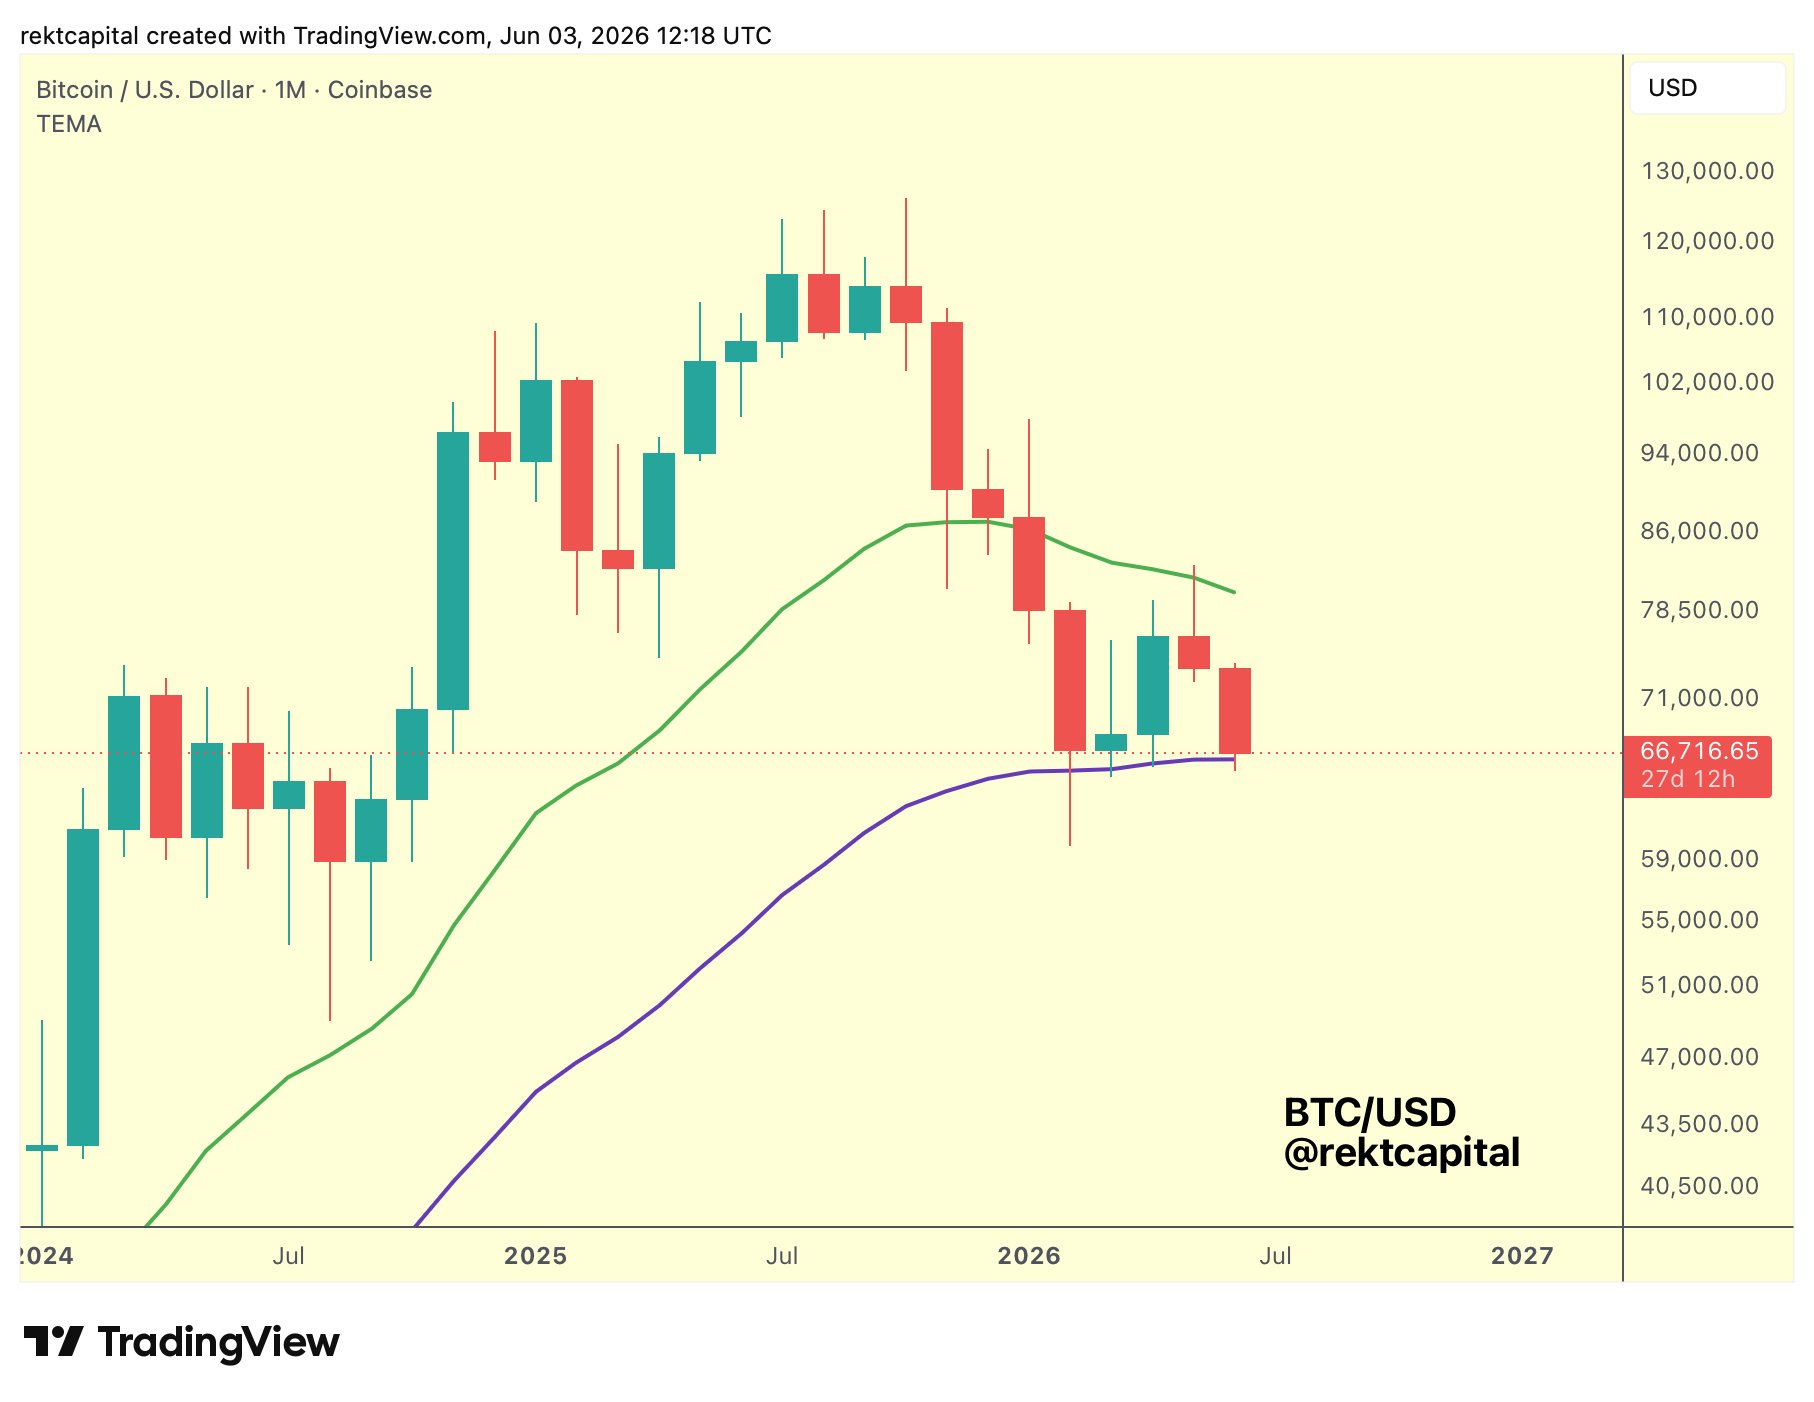
Bitcoin’s price is down around 4.7% in the past 24 hours and 13.8% in the past week. The cryptocurrency traded at $63,157 at the time of writing, down over 20% in the past month, according to TradingView. Spot Bitcoin ETFs have logged $4.4 billion in outflows in the past 13 trading days, Cointelegraph reported earlier on Thursday.
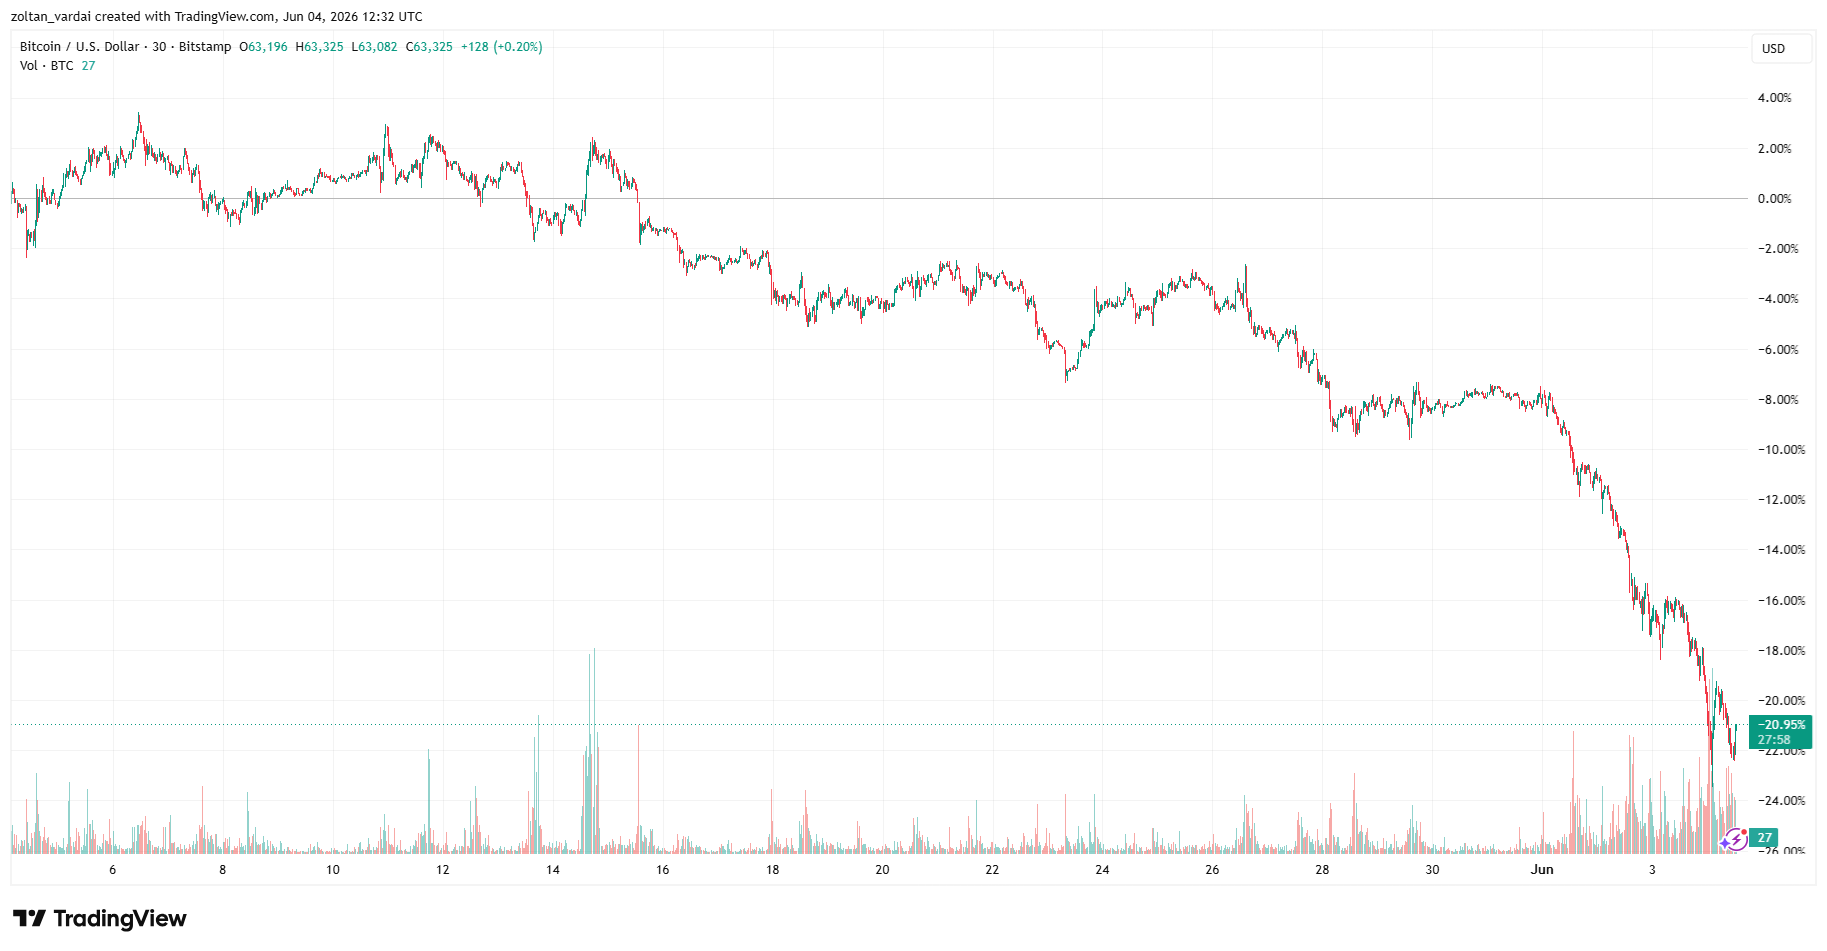
BTC/USD, 1-month chart. Source: Cointelegraph/TradingView
Some market watchers said the STRC move was not unusual.
“STRC’s $100 par value is not a price floor. It’s the stated value used for liquidation preference and certain redemption provisions,” wrote popular investor and podcast host Scott Melker, adding:
“A 5% discount to par is not evidence that something is broken. It’s evidence that investors are demanding a higher yield, pricing risk, or reacting to market conditions – exactly what preferred stocks do.”
Others were less optimistic. Gold bug and long-time Bitcoin critic Peter Schiff said that the lower the STRC price falls, the higher MSTR will be forced to increase dividend payments to “bring the share price back up to $100,” which means that “MSTR will run out of cash much sooner, pulling forward Bitcoin sales to fund payments.”
Related: Capital B seeks $122B funding mandate to buy more Bitcoin
Standard Chartered says Bitcoin bottom near, depending on Strategy’s next move
Despite the sell-off, Standard Chartered predicted that the Bitcoin market bottom may be near, depending on Strategy’s next purchase.
“I would see it as a tentative sign the low has been printed, and given that logic, suspect selling over the weekend will be muted,” said Geoffrey Kendrick, global head of digital asset research at Standard Chartered.
Kendrick said a purchase of 320 BTC or 3,200 BTC, equal to 10 times or 100 times the recent sale, could signal a market bottom.
Following Strategy’s prior tax-loss sale of 704 BTC in 2022, the company purchased 810 BTC just two days later.
Magazine: Bitcoin ETFs bleed $1B, Aave’s $71M ETH unfreeze bid delayed: Hodler’s Digest, May 10 – 16