
Bitcoin (BTC) climbed 3.5% this week to hit $81,325 on Tuesday, its highest level since January. But is Bitcoin’s multi-month highs just a bear-market rally, or has it already bottomed to resume the so-called “supercycle,” as some traders suggest?
Key takeaways:
- Bitcoin may rally to $180,000–$200,000 as institutional accumulation offsets bear-market pressure
- Selling pressure remains firm near the $80,000–$82,000 area.
BTC/USD daily price chart. Source: TradingView
Bitcoin “supercycle” thesis targets $250,000 next
Bitcoin’s rebound now stands at 35.70% from its February low of $59,930. Still, BTC remains roughly 36% below its October 2025 record high near $126,200. This has sparked debate among traders, with some analysts predicting a return to new all-time highs this year.
Bitcoin is not in a typical boom-bust cycle but transitioning into its first “supercycle,” according to analyst PlanC.
In a Tuesday post, he projected a move to above $250,000 by 2027–2028 from the $16,000 bear-market low in November 2022.
His framework splits the current cycle into three phases: an initial rally to $126,000 (already achieved), a mid-cycle correction toward $60,000 (done, as well), and a final expansion phase targeting new highs above $250,000.
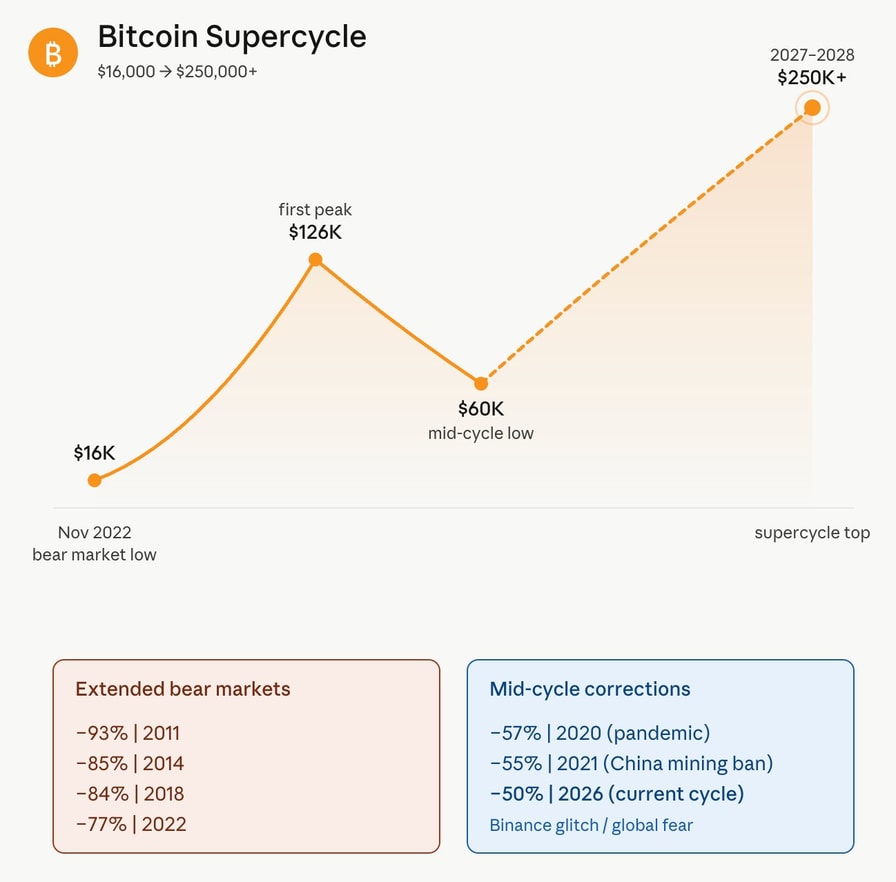
Bitcoin supercycle illustration. Source: PlanC
The key distinction, he noted, is that the recent ~50% drawdown resembles prior mid-cycle resets, such as 2020 and 2021, rather than the deeper 70%–90% bear markets seen in 2014, 2018, and 2022.
In the current scenario, institutional demand is absorbing over 500% of the new daily BTC supply, turning sharp crashes into softer corrections.
Still, the thesis hinges on Bitcoin holding above its mid-cycle floor near $60,000. A breakdown below that level would invalidate the supercycle theory and reopen the case for a prolonged bear phase.
“I think once BTC clears the mid 80’s and holds the chances of seeing new highs are quite high,” analyst Pentoshi said in a Tuesday post, citing the ongoing supply squeeze.
He added:
“In terms of probabilities, I think the lows are in and we could see BTC trade as high as $180k between this year and next.”
Elliott Wave setup hints that Bitcoin’s bottom is in
Bitcoin’s latest rebound has strengthened the case that its correction from the January 2025 high has ended, according to trader Decode’s Elliott Wave analysis.
The chart shows BTC likely completing a three-part A-B-C correction, with the final “C” wave bottoming near $60,000. In Elliott Wave terms, that usually marks the end of a corrective phase and can precede a new five-wave advance.
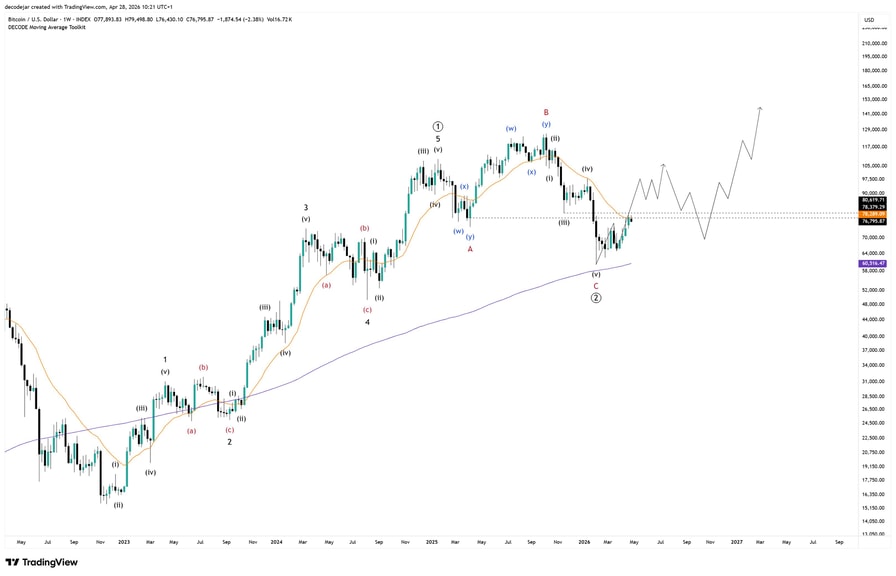
BTC/USD weekly chart. Source: TradingView/Decode
Decode notes that Bitcoin has now moved back above its November low, even if only slightly. That overlap invalidates bearish wave counts that expected “one more low” within the same downward impulse.
As a result, the bearish case has narrowed. BTC could still be inside a larger correction, but the cleaner setup now suggests the recent $60,000 area was likely a cycle low.
A decisive reclaim of the $78,000–$80,000 range as support would further boost the odds of a BTC price rally toward $90,000–$100,000 next.
Sellers step in near a key resistance confluence
Bitcoin’s rebound is running into a familiar resistance cluster, raising the risk of a short-term pullback.
As of Tuesday, BTC is testing the confluence of its 200-day exponential moving average (200-day EMA, the blue line) and the upper boundary of a bear flag channel near the $80,000–$82,000 region.
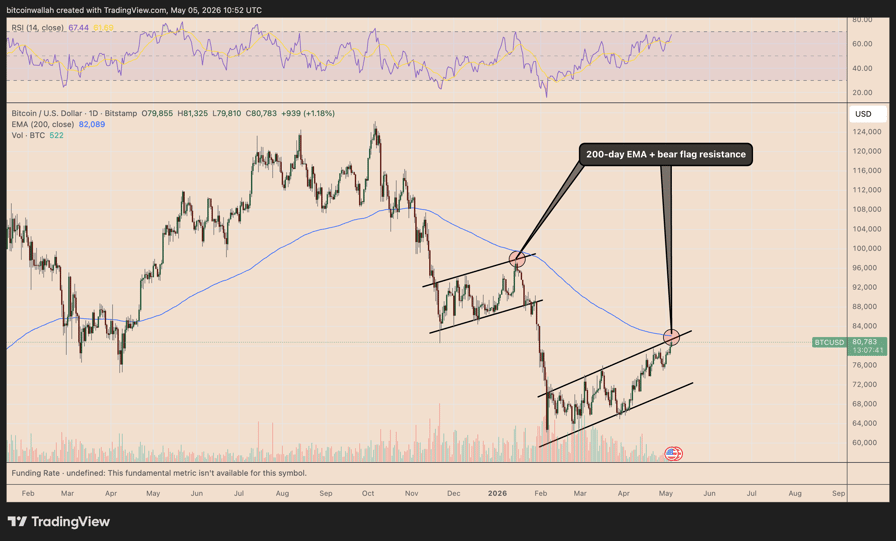
BTC/USD daily chart. Source: TradingView
This resistance confluence increases the odds of a Bitcoin pullback in the coming days, with the downside target sitting around the flag’s lower trendline near the $70,000–$72,000 area.
A breakdown below the bear flag’s lower trendline risks pushing the price under $50,000.
A similar setup played out in January, when Bitcoin rallied into its 200-day EMA after a prolonged downtrend but failed to break higher. The rejection triggered another leg down before a more durable bottom eventually formed.
Also, the 200-day EMA served as strong resistance to Bitcoin’s bear market rallies in the past, particularly in 2018 and 2022, as highlighted in the chart shared by analyst Jason Pizzino.

Source: X
BTC’s price dropped by an average of 40% after testing the 200-day EMA as resistance during the 2018 bear market. In 2022, the average drawdown was around 35.5%.
Related: Bitcoin short-term cost basis approaches profitability, but $80K must flip to support first
BTC price may decline to the $48,000–$52,000 range if the fractal repeats, aligning with the bear flag downside target.