
A bullish signal from Solana’s MACD indicator hinted at a potential rally, though resistance at $90 could delay the recovery.
Nakamoto taps Bitwise and Kraken for Bitcoin options strategy to hedge risk

Nakamoto launched a Bitcoin derivatives program with Bitwise and Kraken, aiming to generate options premiums and hedge part of its BTC treasury exposure.
Strategy stock beats Bitcoin after rising 25% in a month: BTC bottom in?

Historically, MSTR’s outperformance signals traders are taking more risk, betting Bitcoin’s worst drawdown phase may be over.
XRP Risks 40% Dip Versus Bitcoin Despite Persistent ETF Inflows

XRP (XRP) has fallen about 5% against Bitcoin (BTC) over the past week, and the confirmation of a bearish pattern now points to the risk of more losses ahead.
Key takeaways:
- XRP/BTC’s descending triangle pattern on the weekly chart points to a possible 40% drop toward 0.000011 BTC.
- Persistent institutional demand through US-based spot ETFs supports the case for a recovery in XRP price.
XRP’s descending triangle breakdown is underway
Since late 2024, the XRP/BTC ratio has been consolidating inside a descending triangle on the weekly time frame.
In technical analysis, descending triangles are typically viewed as bearish patterns. The pattern was confirmed when the price produced a weekly candlestick close below the triangle’s lower trend line at 0.000096 BTC, as shown in the chart below.
The downside target is derived by taking the height of the triangle and placing it lower from the point where the price breaks below the pattern’s lower trend line.
XRP/BTC weekly chart. Source: Cointelegraph/TradingView
Using that method, the XRP/BTC pair’s measured downside target comes in near 0.000011 BTC, about 40.5% below current levels.
“$XRP/BTC looks edgy,” technical analyst ChartNerd said in a recent post on X, adding that losing support at $0.000091 would lead to further losses in the XRP/BTC ratio as well as the XRP/USD pair.
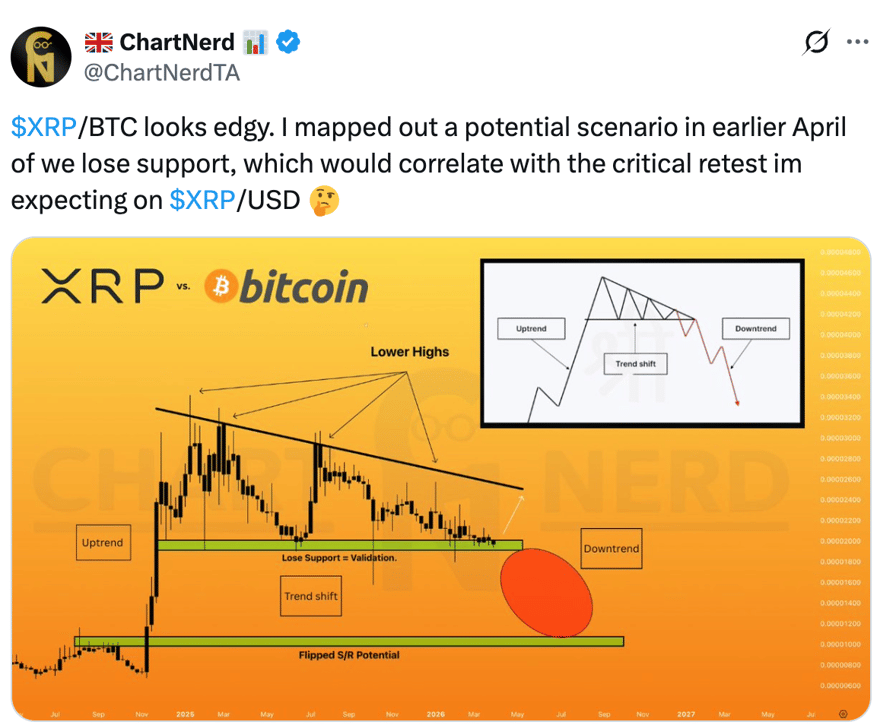
XRP/BTC weekly chart. Source: Chart Nerd
However, the RSI is near oversold at 33, levels that have previously marked macro bottoms for the ratio, as seen in mid- and late 2024. This suggests that the current downtrend could soon come to an end.
As Cointelegraph reported, a similar recovery could be seen in XRP price as several technical and onchain indicators send bottoming signals.
XRP ETF demand makes a comeback
Institutional demand for XRP investment products has been strengthening, according to data from SoSoValue.
US-based spot XRP exchange-traded funds (ETFs) posted $3.89 million in net inflows on Thursday. This marked nine consecutive days of net inflows, totaling $73.78 million. This streak has pushed cumulative inflows to nearly $1.28 billion and AUM to $1.1 billion.
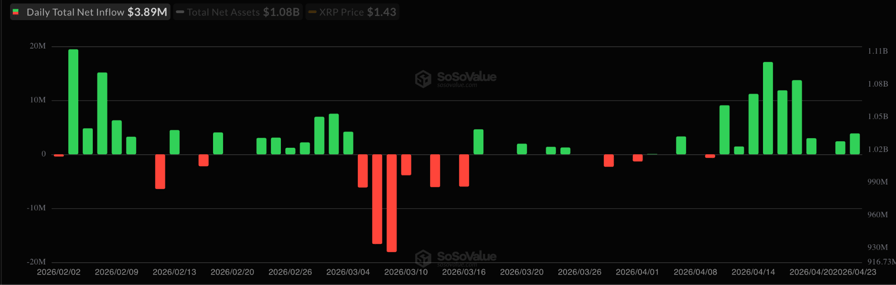
US spot XRP ETF flows chart. Source: SoSoValue
This indicates an increased institutional appetite for XRP products, despite the price declining 22% in 2026 and lagging against Bitcoin.
“$XRP ETF inflows continue,” analyst Don Digital Finance said in a Friday X post.
It signals “steady institutional demand as accumulation continues despite sideways price action,” the analyst added.
“Institutional demand is rising fast as big money continues flowing into XRP exposure,” fellow analyst Ledger Man said, adding:
“This could be a major signal that confidence in XRP is growing stronger than ever.”
This article is produced in accordance with Cointelegraph’s Editorial Policy and is intended for informational purposes only. It does not constitute investment advice or recommendations. All investments and trades carry risk; readers are encouraged to conduct independent research.
AAVE Price Prediction: $105 Target Faces $80 Support Test – Critical 30-Day Crossroads

Ted Hisokawa
Apr 24, 2026 10:41
AAVE trades at a technical inflection point with derivatives data showing smart money positioning for upside despite neutral momentum indicators. The analysts at Blockchain.news identify a 35% prob…
AAVE’s Technical Crossroads
AAVE sits at $94.06 in a state of technical limbo that precedes major directional moves. The RSI at 44.94 occupies neutral territory while the MACD histogram flatlining at 0.0000 confirms momentum has completely stalled. Yet beneath this surface calm, the token managed a 2.72% daily gain, revealing underlying buying interest that contradicts the stagnant momentum readings.
The Bollinger Band positioning at 0.40 places AAVE in the lower half of its trading channel, with the middle band at $96.94 providing immediate resistance and the lower band at $82.14 establishing critical support. This $14.80 range compression typically resolves with sharp breakouts as market participants choose direction.
Institutional vs Retail Positioning
The derivatives landscape reveals a tale of two markets. While $25.6 million in 24-hour spot volume indicates steady institutional participation, the real story emerges from futures positioning. Open interest contracted 2.72% to $58.7 million as the funding rate turned negative at -0.0007%, signaling long position liquidations and smart money rebalancing.
The positioning data exposes a critical divergence: top traders maintain 59.1% long exposure with a 1.44 ratio, while retail sentiment remains balanced at 1.10. This gap between sophisticated and retail positioning historically precedes significant price moves. The taker buy/sell ratio at 0.987 shows minimal selling pressure despite technical weakness, suggesting accumulation continues at current levels.
Market Structure Analysis
AAVE faces a binary setup over the next 30 days based on its technical and derivatives structure. The upside path requires breaking above $96.87 immediate resistance, which would target the stronger resistance zone at $99.68 before potentially reaching $105. This scenario carries approximately 35% probability given current whale positioning and the potential for an oversold bounce.
The downside path involves failure at $91.19 immediate support, triggering algorithmic stops toward $88.32 and potentially the lower Bollinger Band near $82.14. This outcome holds roughly 65% probability as the bearish MACD divergence and neutral RSI provide limited technical support for buyers.
Volatility Window
The 7-day outlook appears particularly volatile given AAVE’s $8.71 Average True Range, suggesting daily moves approaching 9% remain probable. Smart money positioning favors the upside breakout scenario, but sustained rallies above $100 require retail participation to follow institutional accumulation patterns.
The absence of fresh fundamental catalysts means AAVE trades purely on technical levels and derivatives flows, potentially enabling cleaner price discovery without external narrative interference.
Image source: Shutterstock
US Soldier Charged Over $400K Polymarket Bet on Maduro Ouster

Luisa Crawford
Apr 24, 2026 02:27
Master Sergeant Gannon Ken Van Dyke faces charges for using military intel to profit $400,000+ on Polymarket bets tied to Maduro’s removal.
A U.S. Army soldier, Master Sergeant Gannon Ken Van Dyke, has been charged with leveraging classified military intelligence to profit $409,881 on Polymarket prediction contracts tied to the planned capture of Venezuela’s former president, Nicolás Maduro. According to a U.S. Department of Justice (DOJ) statement released Thursday, Van Dyke’s actions allegedly violated both military protocols and federal law.
The DOJ revealed that Van Dyke participated in the planning and execution of “Operation Absolute Resolve,” the January operation that led to Maduro’s capture in Caracas. Using this inside knowledge, Van Dyke reportedly made a series of high-stakes bets on prediction contracts such as “Maduro out by January 31” and “Trump invokes War Powers against Venezuela by January 31.” These bets were placed between December 27, 2025, and January 2, 2026, just days before the operation took place.
Polymarket, a decentralized prediction market platform, flagged and referred the trades to the DOJ, stating, “Insider trading has no place on Polymarket.” The platform claims to have cooperated fully with the investigation. Van Dyke later attempted to cover his tracks by asking Polymarket to delete his account and allegedly funneling much of his illicit gains into a foreign crypto vault.
The charges against Van Dyke are severe, including unlawful use of confidential government information, commodities fraud, wire fraud, and an unlawful monetary transaction. The wire fraud charge alone carries a maximum sentence of 20 years in prison. FBI Director Kash Patel emphasized the broader implications, stating, “Today’s announcement makes clear no one is above the law.”
Prediction Markets Under Scrutiny
Prediction markets like Polymarket allow users to bet on real-world events, from political outcomes to geopolitical developments. While the concept has democratized speculative trading, it has also drawn criticism for creating opportunities to profit from sensitive or classified information. Regulatory agencies, including the U.S. Commodity Futures Trading Commission (CFTC), have started cracking down on misuse. CFTC Chair Michael Selig commented that such cases “put the lives of American service members in harm’s way.”
This incident is not isolated. In February, Israeli authorities arrested a military reservist for allegedly using classified information to profit on Polymarket contracts tied to Israeli strikes on Iran. Such cases highlight the growing concerns around the exploitation of decentralized platforms for insider trading.
What’s Next?
Van Dyke’s case underscores the evolving regulatory challenges facing prediction markets. Polymarket and its competitors have reportedly implemented stronger surveillance measures to combat insider trading, but high-profile cases like these raise questions about the enforcement gap.
Beyond the legal implications for Van Dyke, this case serves as a cautionary tale about the misuse of decentralized platforms. As regulatory scrutiny intensifies, the crypto community will likely see more stringent oversight and enforcement in an effort to balance innovation with accountability.
Image source: Shutterstock
$3,000 Ether Depends On More Than Just Strong Spot ETH ETF Inflows

Key takeaways:
- The spot ETH ETFs recorded 10 consecutive days of net inflows, totaling $633 million.
- Weekly DApps revenue on the Ethereum network fell to $13 million, following a broader decline seen in Solana and BNB Chain.
Ether (ETH) struggled to trade above $2,400 on Thursday, but consistent inflows into Ethereum spot exchange-traded funds (ETFs) reflect the bulls’ attempt to regain momentum. Ether’s price rallied alongside Bitcoin’s (BTC) recovery to $79,000, prompting traders to question whether ETH will attempt a run to $3,000.
Spot ETH ETF daily net flows, USD. Source: SoSoValue
On Wednesday, the ETH spot ETFs completed 10 consecutive days of net inflows, totaling $633 million. This shows that traders are gradually reclaiming confidence after ETH abruptly fell by 42% between Jan. 28 and Feb. 6. The cryptocurrency market crash reduced interest in decentralized applications (DApps), which proved especially burdensome for ETH investors.
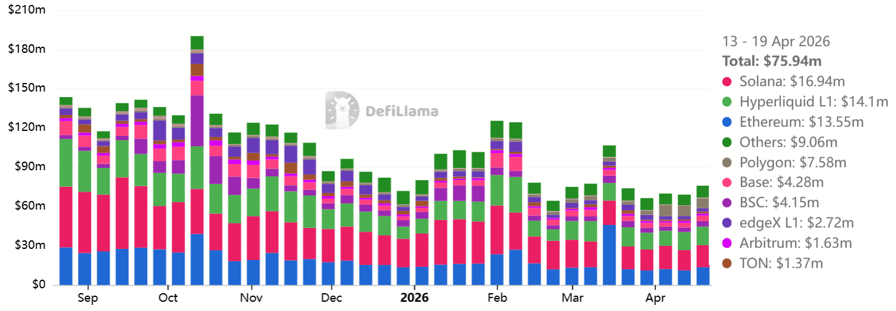
Weekly DApps revenue by chain, USD. Source: DefiLlama
DApp revenues on the Ethereum network dropped to $13 million per week in April, nearly 50% lower than six months prior. However, the decline in decentralized exchange (DEX) volumes has also plagued other major competitors to a similar extent, including Solana, BNB Chain and Hyperliquid. The aggregate weekly blockchain DApps revenue has fallen to $73 million, down from $130 million in October 2025.
Ethereum well-positioned to capture demand for DApps
Despite recent bullish momentum, ETH is down 22% year-to-date in 2026, while the broader cryptocurrency market capitalization is down 14%. Ether’s underperformance may be interpreted as a buying opportunity, especially as the Ethereum network remains the leader in total value locked (TVL) and its layer-2 solutions have gained significant market share in DEX volumes.
Regardless of the ETF inflows, the demand for bullish leveraged ETH positions has plummeted to its lowest level in four months.
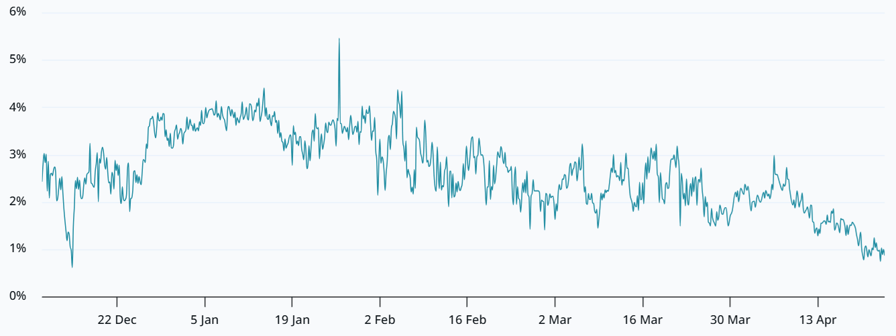
ETH two-month futures basis rate. Source: Laevitas
The annualized ETH monthly futures premium relative to regular spot markets (basis rate) dropped to 1% on Thursday, well below the 4% neutral threshold. Still, it is incorrect to assume that professional traders are bracing for downside solely due to a lack of confidence in derivatives markets. The uncertain macroeconomic environment might explain trader skepticism, especially after major tech companies’ quarterly earnings disappointed investors.
IBM (IBM US) shares dropped nearly 10% on Thursday due to investor concerns regarding increased competition from the artificial intelligence sector, according to Yahoo Finance. In parallel, Morgan Stanley trimmed its price target on Oracle (ORCL US) due to uncertainty in the margin profile and buildout costs of the company’s expanding investment in AI computing data centers.
Related: BlackRock drives 7-day Bitcoin ETF inflow streak as BTC nears $80,000
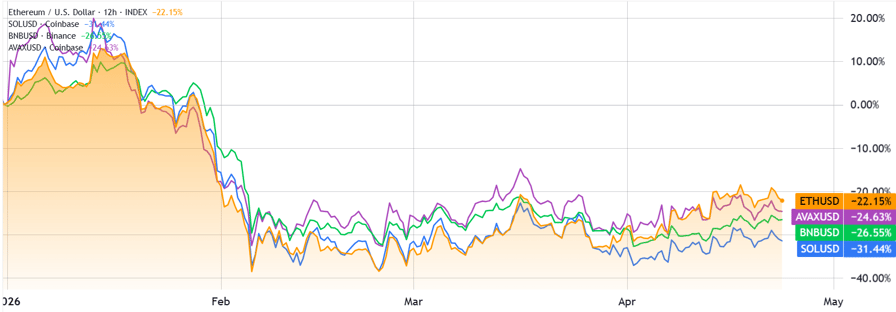
ETH vs. BNB, SOL, AVAX. Source: TradingView
Ether’s potential bullish momentum likely depends on reduced risk aversion toward cryptocurrencies, as its price chart relative to some competitors shows striking similarities. The recent spot Ether ETF inflows, while relevant, are not enough to justify a decoupling, especially as activity in the DApps sector has yet to show signs of improvement.
There is no indication that ETH is bound for $3,000, but the Ethereum network seems well-positioned to capture an eventual pickup in demand for decentralized computation.
This article is produced in accordance with Cointelegraph’s Editorial Policy and is intended for informational purposes only. It does not constitute investment advice or recommendations. All investments and trades carry risk; readers are encouraged to conduct independent research.
Bitcoin enters disbelief phase as USDC exchange reserves push above $7.5B

A negative Bitcoin funding rate and $7.5 billion in USDC reserves suggest traders may start positioning against the bearish trend. Will BTC price keep rising?
Ethereum Metrics Signal ETH Price Rally Toward $6K Next

Ether’s (ETH) 33% rally from its sub-$1,800 multi-year lows appears to be cooling, but several key metrics suggest the top altcoin may be primed for a bigger rally toward $6,000 or higher.
Key takeaways:
- Ether is currently displaying a technical setup similar to past cycles that ignited a massive rally in ETH price.
- Supply squeeze potential is growing as increasing accumulation and exchange outflows reduce immediate sell pressure.
- A rising Coinbase premium reflects the return of US institutional demand.
Ether’s fractal targets a $6,000 ETH price
Ether is currently bouncing off a multi-year trend line that has historically marked macro ETH price bottoms. Previous instances in April 2025 and mid-2022 resulted in 260% and 130% ETH price rallies, respectively.
“$ETH is holding a long-term ascending trendline support,” analyst CryptoJack said in a recent X post, adding:
“Will history repeat itself?”
ETH/USD weekly chart. Source: Cointelegraph/TradingView
A bullish cross from the moving average convergence divergence (MACD) indicator also confirmed the price bottom.
“$ETH weekly MACD bullish cross is now confirmed,” analyst Ash Crypto said in a recent X post, adding:
“The last 2 times this happened, ETH pumped 183% and 75%.”
The weekly RSI is meanwhile recovering from levels that marked previous macro lows, suggesting that Ether’s recent drop to $1,750 was the bottom.
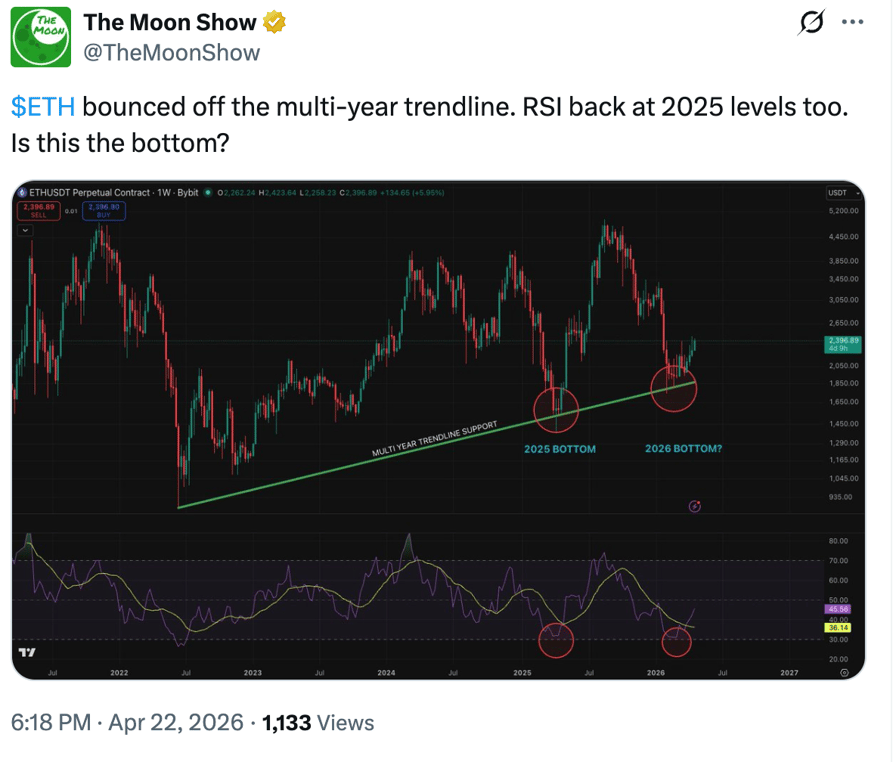
ETH/USD weekly chart. Source: The Moon Show
Ether’s current price action is following a similar pattern, with the price again bouncing off the same structural support, a confirmed bullish MACD crossover, and the RSI’s recovery from oversold conditions.
If history repeats itself, ETH may rally by between 75% and 260% from the bottom, placing Ether’s upside target at $3,000-$6,300.
ETH supply squeeze potential rises
Ethereum’s on-chain metrics reveal a tightening supply dynamic, an occurrence that has previously ignited significant ETH price rallies.
The Binance ERC-20: Stablecoin Whale Activity Index indicator reveals structural supply exhaustion.
The chart below shows that the number of daily accumulation addresses (wallets steadily buying ETH) has increased to 2,434, surpassing the number of exchange depositing addresses (wallets preparing to sell), which has dropped to 2,300.
This shift suggests that large players have moved from a “wait-and-see” phase into active accumulation, CryptoQuant analyst GugaOnChain said in a recent QuickTake analysis.
“This scenario is extremely positive for the price structure, as it reveals that there are significantly fewer addresses sending ETH to the exchange with the intention to sell than players accumulating or positioned to absorb liquidity,” the analyst said, adding:
“The supply shock is fully underway.”
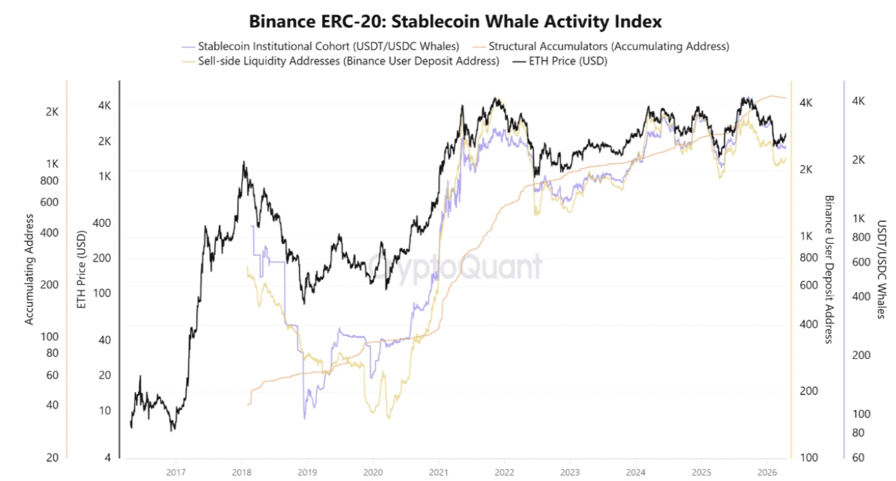
Binance ERC-20 stablecoin whale activity index. Source: CryptoQuant
This is also seen in increasing exchange outflows, as the ETH net position change among exchanges for the past 30 days fell by 1.4 million ETH on April 2, marking the largest spike in seven months, according to Glassnode data.
The net position change is at -351,300 ETH (30 days) at the time of writing on Thursday.
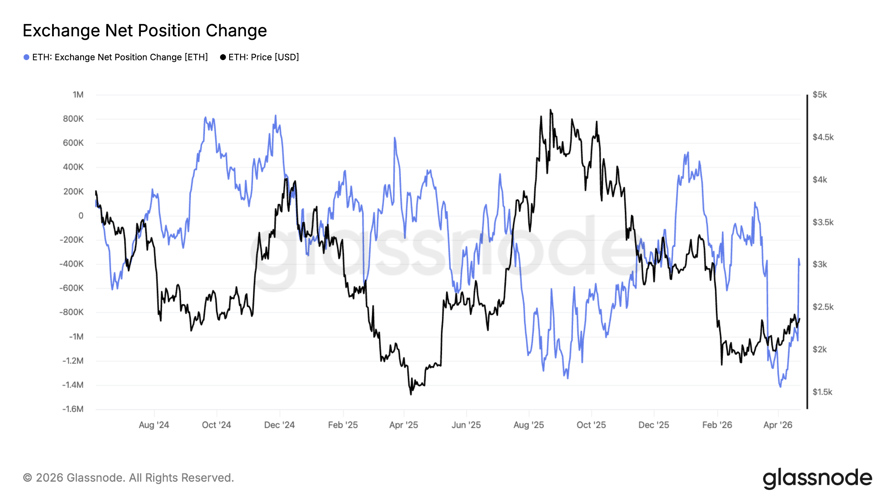
ETH: Exchange net position change. Source: Glassnode
Such outflows typically indicate strong accumulation by large holders, who move tokens to cold storage or invest in investment products, thereby reducing immediate sell pressure.
This is usually referred to as a “supply squeeze,” conditions that have, historically, preceded sharp upside moves, especially when combined with improving market sentiment.
Ethereum demand recovers
As Cointelegraph reported, Ether futures on Binance have risen to a near two-month high as aggressive buyers stepped into the market over the past week. Buy-taker volume rose above $5 billion, and the current setup leans bullish.
The US market is driving a significant share of this demand, as measured by the Coinbase premium index.
The ETH Coinbase premium index measures the price difference between the ETH/USD pair on Coinbase and Binance.
This metric flipped positive on April 4, rising to 0.055 on April 14, its highest level since October 2025. The index fell to as low as -0.21 in early February and has now recovered to 0.04.
This typically signals increased demand from institutional investors, particularly in the US market.
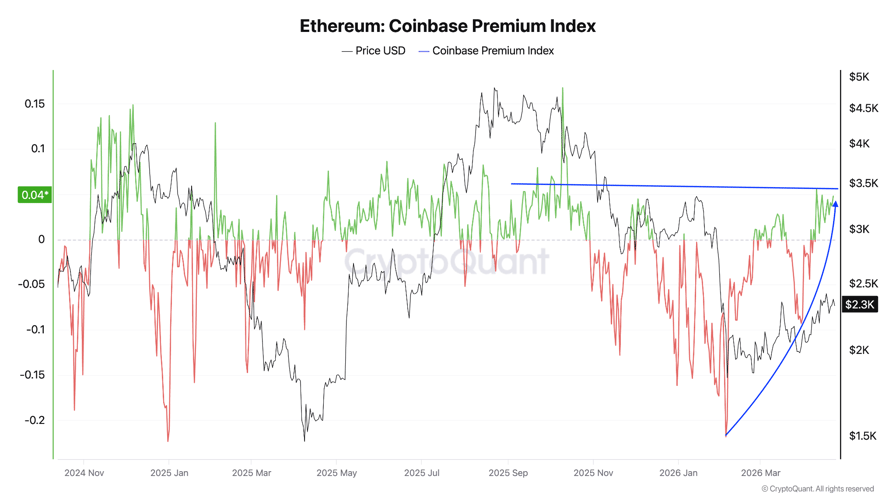
Ethereum Coinbase Premium Index. Source: CryptoQuant
Meanwhile, spot Ethereum ETFs have recorded net inflows for 10 consecutive days, totaling $590 million. This marks the longest inflow streak since December 2024, accompanying a 95% ETH price rally in Q4 2024.
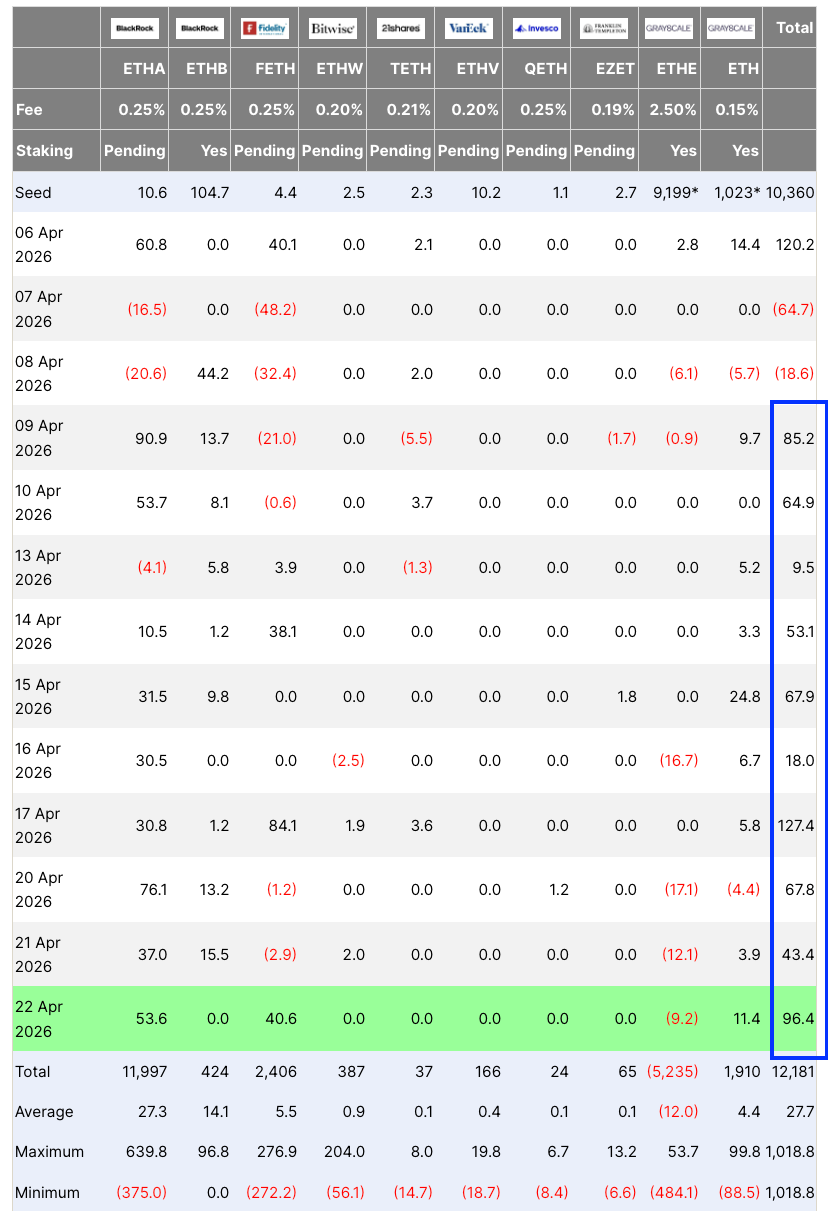
Spot Ethereum ETF flows table. Source: SoSoValue
Meanwhile, Bitmine Immersion Technologies, the world’s largest public holder of Ether, increased its holdings last week with another 101,627 ETH purchase, reflecting a return of demand for ETH among institutional investors.
This article is produced in accordance with Cointelegraph’s Editorial Policy and is intended for informational purposes only. It does not constitute investment advice or recommendations. All investments and trades carry risk; readers are encouraged to conduct independent research.
Bitcoin Bulls Fight For Bull Market Support Band Into Weekly Close

Bitcoin (BTC) slipped from near three-month highs on Thursday as attention turned to the weekly close.
Key points:
- Bitcoin retraces after its latest trip to its highest levels in several months.
- The upcoming weekly candle close is of particular interest as price eyes its bull market support band.
- A macro lull comes ahead of a deluge of US inflation data next week.
Bitcoin bull market support band returns after six months
Data from TradingView showed BTC/USD dropping to $77,200 prior to the Wall Street open.
The pair hit $79,500 the day prior, marking its highest levels since the last day of January as the $80,000 mark remained narrowly out of reach.
BTC/USD one-hour chart. Source: Cointelegraph/TradingView
“$BTC just keeps taking out the highs, taking out short stops without following through,” trader Jelle commented on the latest price action in a post on X.
“Been a while since we saw PA like that; usually means liquidity is being generated for a larger position. The question is, when will they step on the gas?”

BTC/USD four-hour chart. Source: Jelle/X
As Cointelegraph reported, multiple resistance levels remain in play in the current spot price zone, with the 21-week exponential moving average (EMA) proving hard to flip to support. Bitcoin last traded above that trend line in October 2025.
With that, another chart feature finally making a comeback after a six-month absence is Bitcoin’s bull market support band.
Formed by the 21-week EMA and the 20-week simple moving average (SMA), the support band was lost as support soon after Bitcoin’s latest all-time highs.
“$BTC Attempting to break back above the bull market support band,” trader Daan Crypto Trades confirmed.
“Eyes on the weekly close this weekend, as it will be an important one. Bitcoin has not traded above its bull market support band since October 2025.”
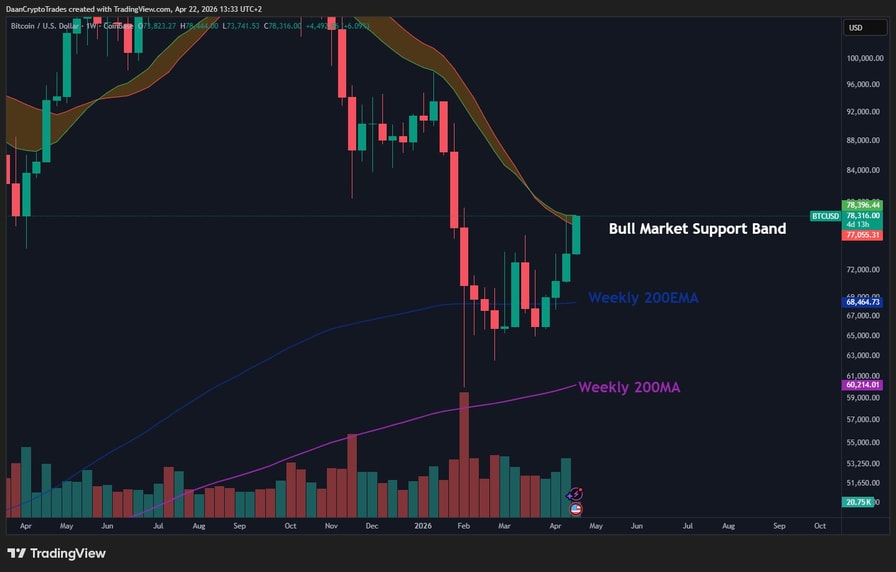
BTC/USD one-week chart. Source: Daan Crypto Trades/X
Fed policy, oil seen as next crypto catalysts
Macro markets provided little volatility on the day, with few cues from the US-Iran war.
Related: Bitcoin Bull Score hits six-month high as 2022 bear-market fears linger
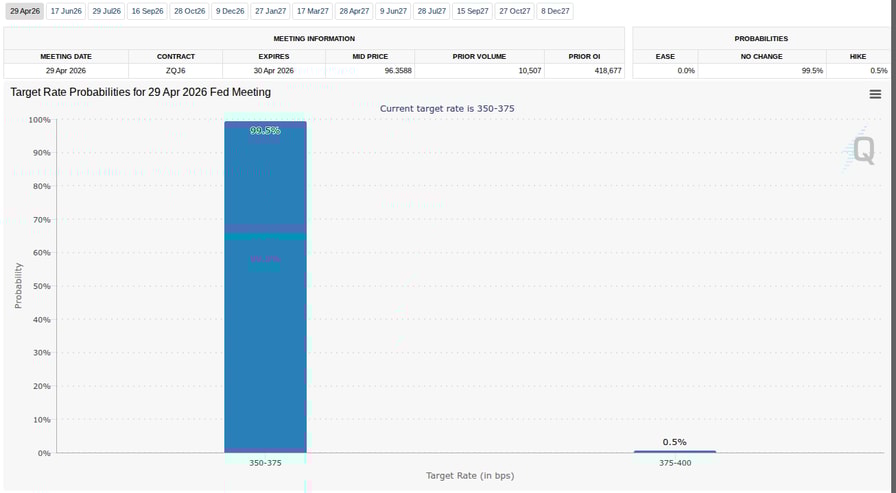
The coming week was due to see key US macroeconomic data prints released, along with the latest interest-rate announcement from the Federal Reserve.
As Cointelegraph previously noted, markets saw little chance of Fed easing policy until the end of 2027 as geopolitical uncertainty raised the odds of inflation making a comeback.
The latest data from CME Group’s FedWatch Tool put the chances of the Fed changing rates at next week’s meeting at practically zero.
“The cleanest tells from here are still oil and policy. Oil below $100 would support the relief case, while clearer Fed signalling would help compress the policy premium,” trading company QCP Capital wrote in its latest “Market Color” analysis on Wednesday.
“Until then, the broader message remains the same: risk has stepped back from the brink, but the underlying macro and geopolitical overhang has not been cleared.”
Fed target rate probabilities (screenshot). Source: CME Group
This article is produced in accordance with Cointelegraph’s Editorial Policy and is intended for informational purposes only. It does not constitute investment advice or recommendations. All investments and trades carry risk; readers are encouraged to conduct independent research.